
E3 BinckBank Classic Maps
The E3 Binckbank Classic 2019 is approaching fast. When doing some ‘field research’ on the official website I discovered that the organizers actually put a GPX file on their website. Basically this file contains the GPS data in a standardized format. It also includes the elevations in meters. I was intrigued, and decided to give it a go and have some fun with it. After some digging I also managed to find a GPX file of last year’s parcours, so we can make some comparisons.
Before we get to the results it is good to know that I never worked with with geo data before. So please let me know if something may be incorrect so I can fix it.
Now let’s take a look at the results. First, I simply plotted the 2019 and 2018 parcours on a map. The year 2019 is orange-ish, 2018 is blue, hence an overlap of the track is some sort of purple. You can immediately see some big changes in the route. For example:
- In 2019 the race passes the city of Oudenaarde on the north instead of the south.
- In 2019 the peloton is directed immediately south in Ophasselt, whereas in 2018 they continued to the east and made a lap around Voorde.
- Smaller changes are visible around Etikhove, Ronsde and Waregem.
If you zoom in on the map you can also see that all hills/mountains are marked with small orange triangles (just not interactive).
Figure 1: E3 track in 2018 (blue), and 2019 (orange), the overlap is purple.
Next up is using the elevation data. At first sight the elevation data may not be that accurate as it’s rounded on whole meters. A slope is calculated by dividing elevation in meters by distance in meters, but at small distances having elevations rounded in meters leads to huge slopes. I decided to calculate slopes over (approximately) each 200 meters. During these 200 meters I sum only the increase in elevation to determine the total elevation during that piece of road and subsequently determine the slope. In the map in Figure 2 you can see the 2019 route and the steeper slopes.
Figure 2: E3 Binckbank Classic parcours with highest elevation points marked.
Finally, I made some more simple plots of the elevation. In Figure 3 you can see the level of elevation of the parcours in 2018 and 2019. Furthermore, in Figure 4 you find the total cumulative elevation in both years (so the sum of the positive elevation meters).
It seems there is a huge increase in total elevation in 2019 compared to the 2018 route. It could be true, but at first sight it seems a bit weird. Especially, if you take into account that the route differences between 2018 and 2019 (in Figure 1) are not that big. My first guess is that the GPX files are constructed with different equipment what could cause such differences.
To get some ‘security’ about the elevation quality I also collected Google Maps elevation data for the 2019 track. These are also shown in Figure 4 (light blue line). The Google Maps elevations match reasonably well with the official GPX elevations, so for now the 2019 elevations look good, later I will still try to see whether the Google elevations for 2018 are different.
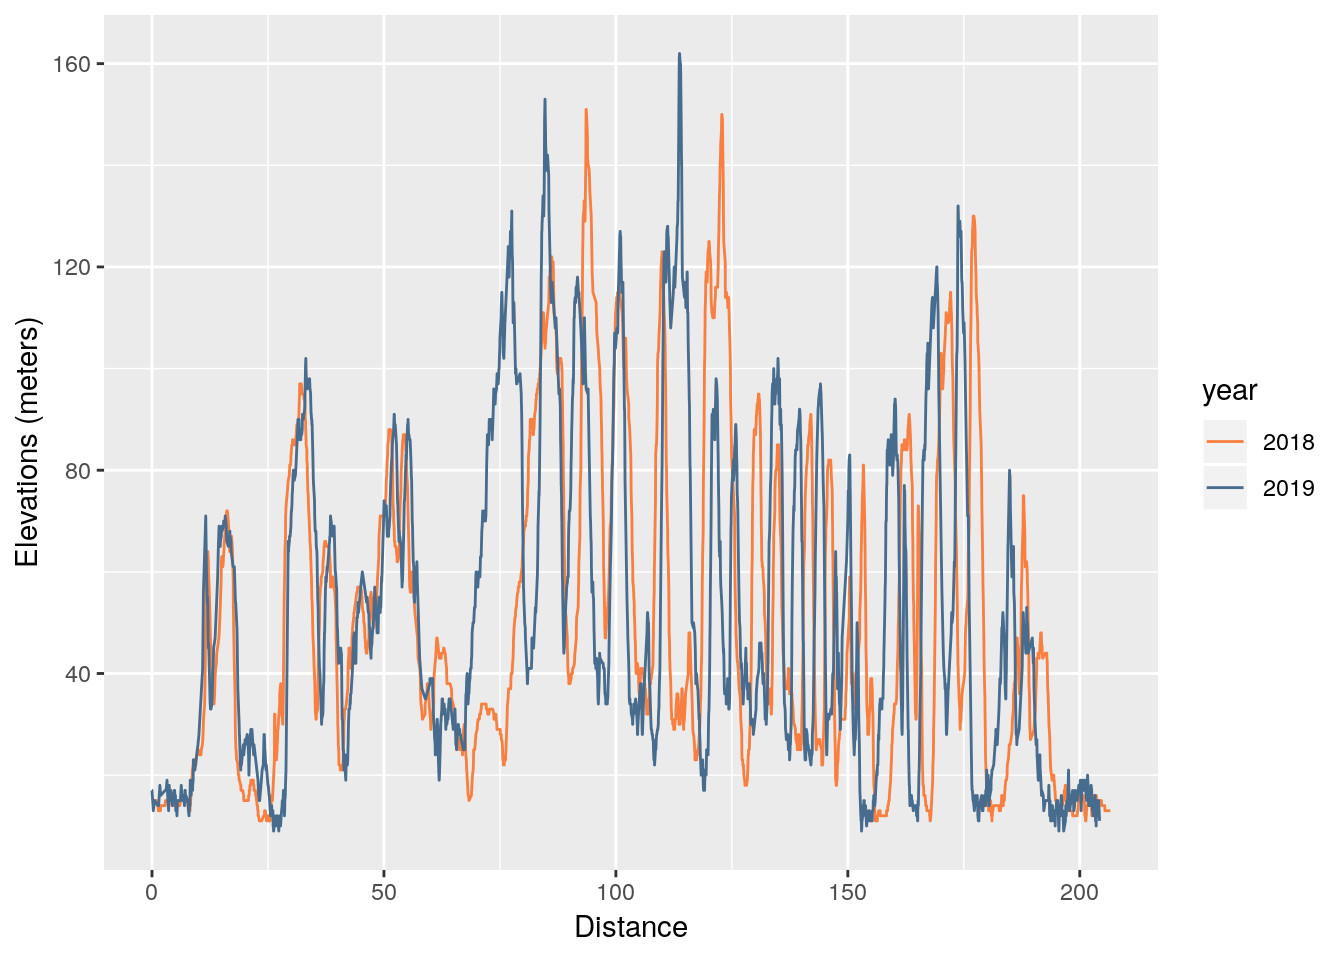
Figure 3: E3 Binckbank Classic elevation during the race in 2018 and 2019
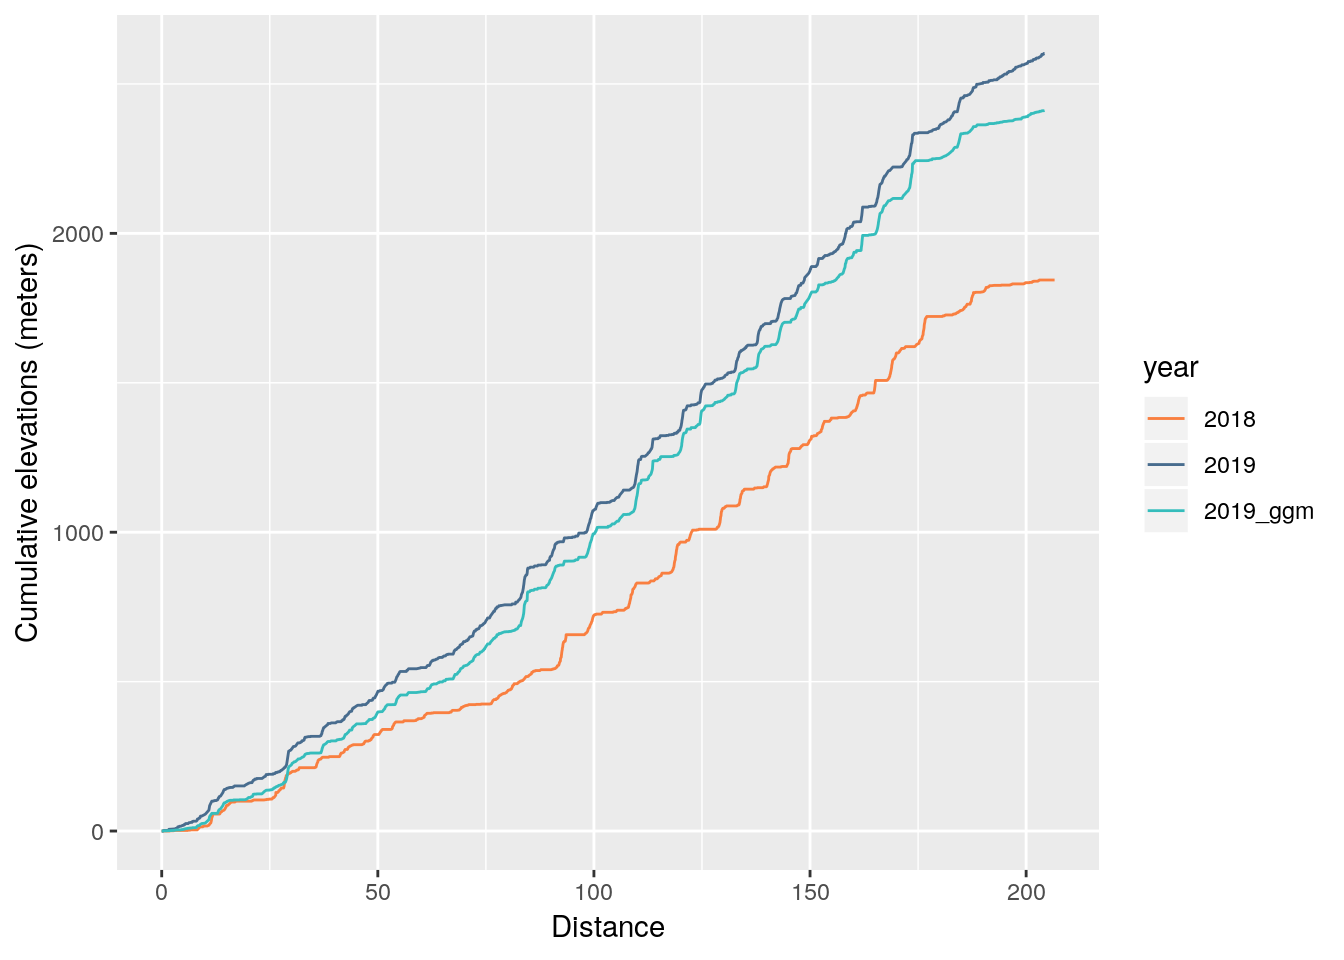
Figure 4: E3 Binckbank Classic cumulative elevation in 2018 and 2019.
The last figure below is exactly the same as Figure 2 only now the slopes are added based on the Google Maps elevation data.
Figure 5: E3 Binckbank Classic parcours with highest elevation points marked.
If you have other suggestions don’t hesitate to send us a message on Twitter or email.