Tour de France 2019 Stages and Elevation
It has been quite a while since the last analysis and by now we are more than half way the Tour de France 2019. One of the most interesting Tour in years if you ask me. Julian Alaphilippe in yellow, no truly dominant team and many surprising stages. The past four stages took place in the Pyrenees. In this post we will take a look at the past mountain stages and their relative difficulties. For this we use Strava data from Thibaut Pinot and Sébastien Reichenbach.
Don’t forget to check out our Tour de France race page with a lot of race statistics
The first problem that we encounter is that the actual stage data from Strava does not include the Tour de France climb categorizations. All climb information is collected from the official Tour de France website. However, it appears that the climb location (kilometers since the start/beginning) does not really match with the Strava information. This is actually solved by manually aligning the official Tour de France profiles with the Strava profile that results from combining the gradient adjusted distance and elevation information. When aligning we always stuck to the official climb length from the Tour website. You can see the result of this exercise in Figure 1. In this figure you can see the Stava profile in black and the categorized climbs as shaded yellow regions. In the subplot title you can also find the Tour stage label. Here FLA, HIL and MNT indicate, respectively, a flat, hilly and mountain stage. The abbreviations ITT and TTT are the Individual and Team Time Trials.

Figure 1: Tour de France 2019 profiles based on Thibaut Pinot and Sébastien Reichenbach Strava rides aligned with official Tour de France profiles.
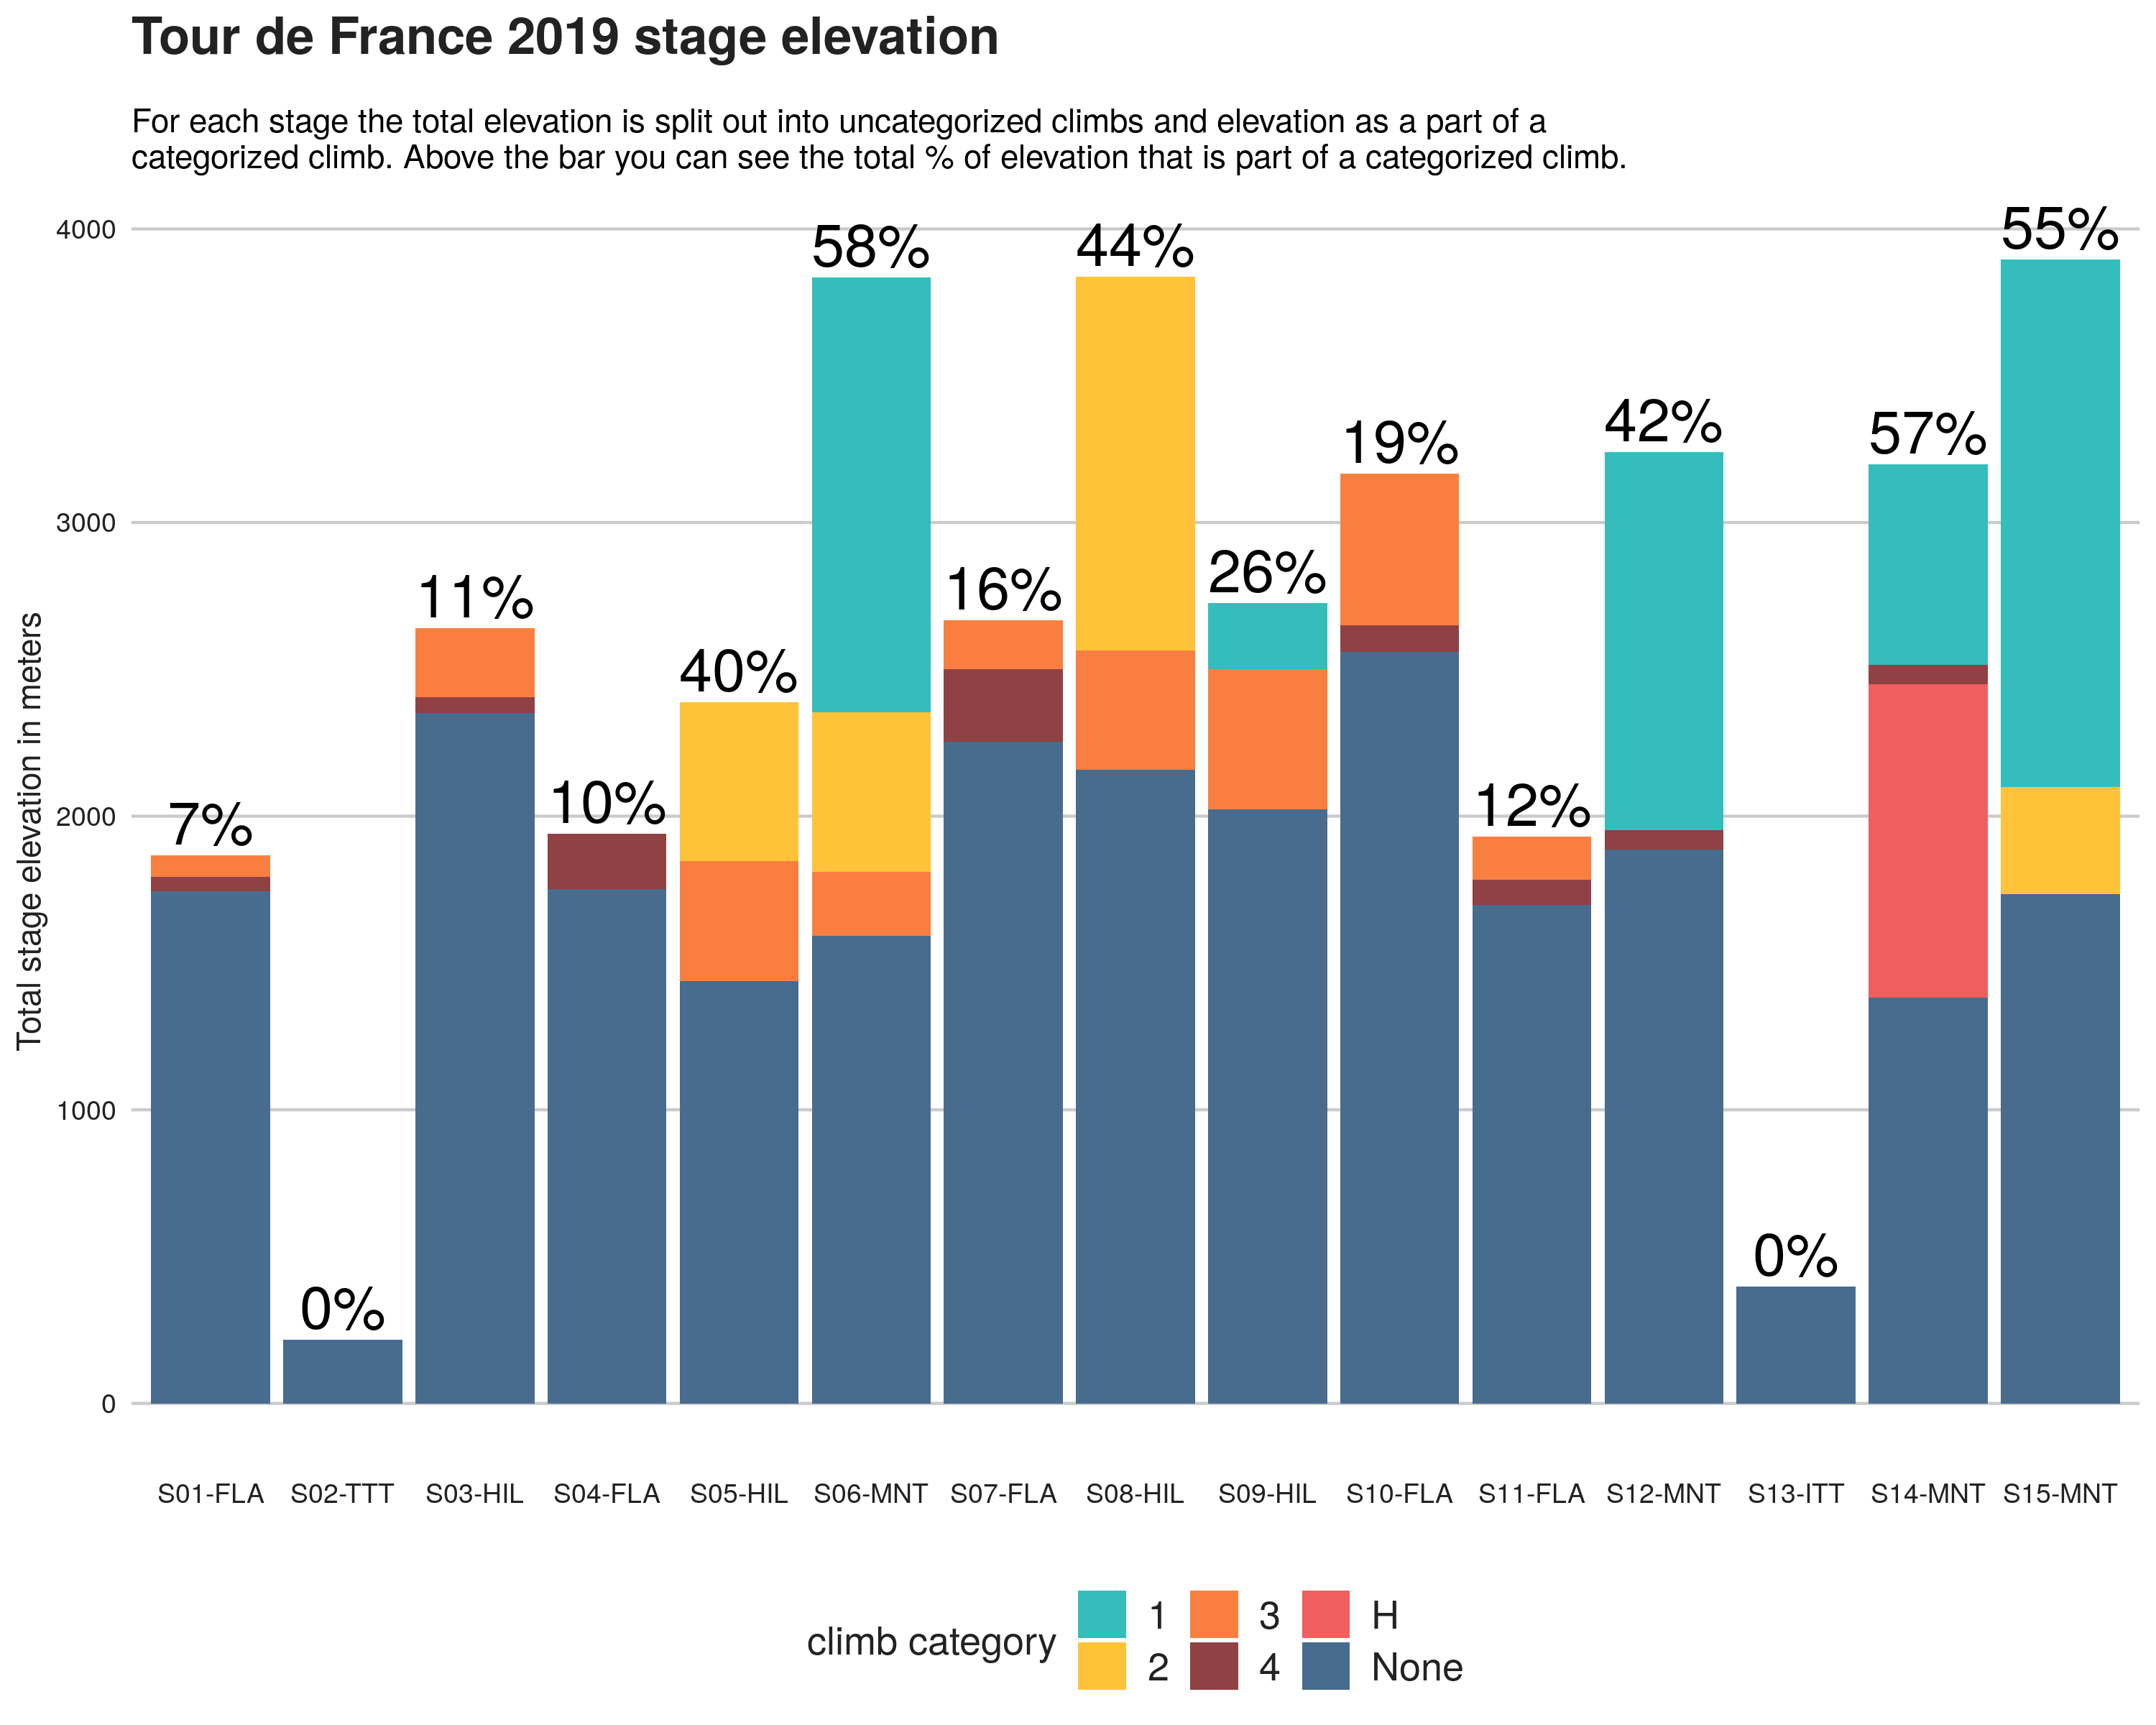
As you can see stage 2 and stage 13 have no categorized climbs, since these were (team) time trials. Sometimes the alignment just took a few hundred meters, in other stages it was more than a few kilometers. When aligning we really tried to capture the most elevation within the official climb length. Note that the axis on all figures are different, so elevation differences between e.g. stage 1 and stage 1 are very substantial. Now we have the actual race elevation and categorized climb elevation aligned we can calculate stage-by-stage the total elevation and the part of this total elevation that is actually categorized. This is shown in Figure 2.
The first noteworthy observations is that flat stages are definitely not that flat at all. The ‘flattest’ stages (stages 1, 4 and 11) still have close to 2000 meters of total elevation. Stages 7 and 10 are also classified as flat, but contain more elevation than some hilly stages. The only difference is that the categorized elevation is of a lower category. The same holds for the hilly stages. Take for example stage 8 - hilly according to the Tour de France organization. With nearly 4000 meters of total elevation it is comparable with mountain stages 6 and 15. The only difference is that this elevation is of a lower category.
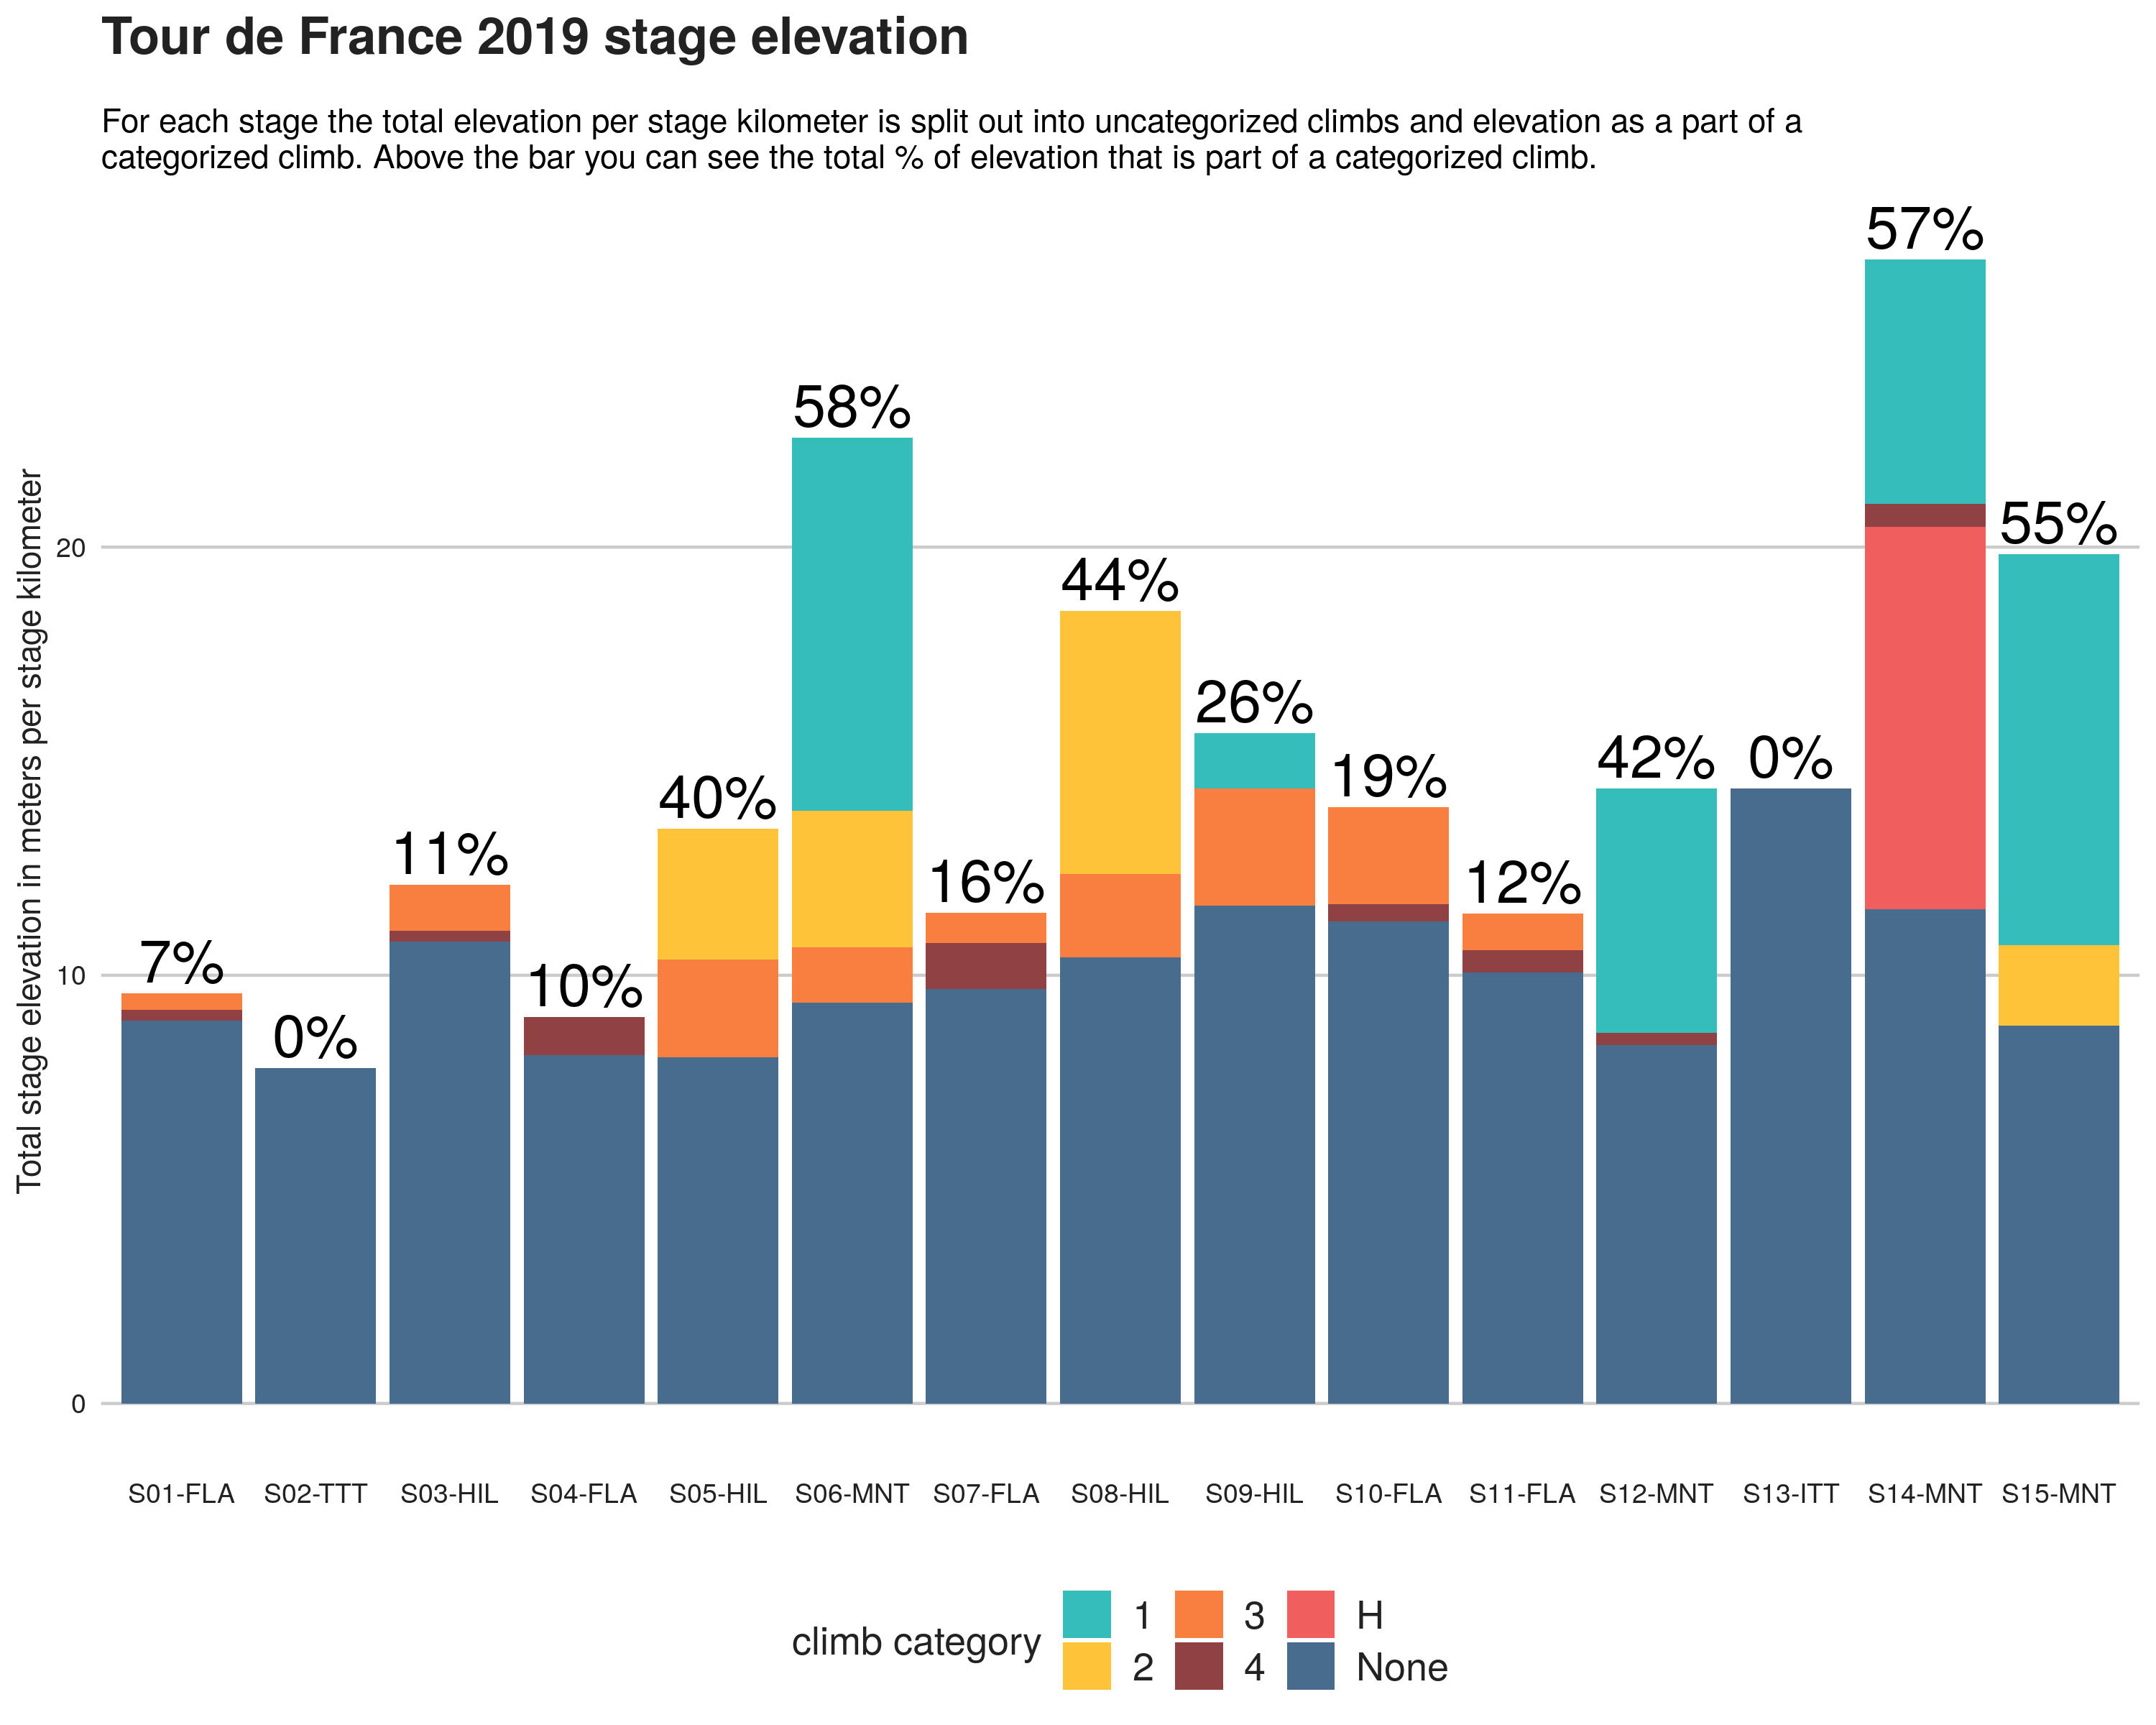
This leaves us with the mountain stages 6, 12, 14 and 15. The first thing that distinguishes them is the percentage of climbing meters that is classified with category 1 or ‘H’. The second important aspect is stage length. In Figure 3 is identical to Figure 2, except that we scaled total stage elevation by the stage length. So on the vertical axis you now see total elevation in meters per stage kilometer. Now the mountain stages really stand out. They pack a lot of climbing intensity in relatively few kilometers.

Figure 2: Tour de France 2019 total actual stage elevation based on Thibaut Pinot and Sébastien Reichenbach Strava rides split out for uncategorized and categorized climbing meters.

Figure 3: Tour de France 2019 total actual stage elevation per stage kilometer based on Thibaut Pinot and Sébastien Reichenbach Strava rides split out for uncategorized and categorized climbing meters.
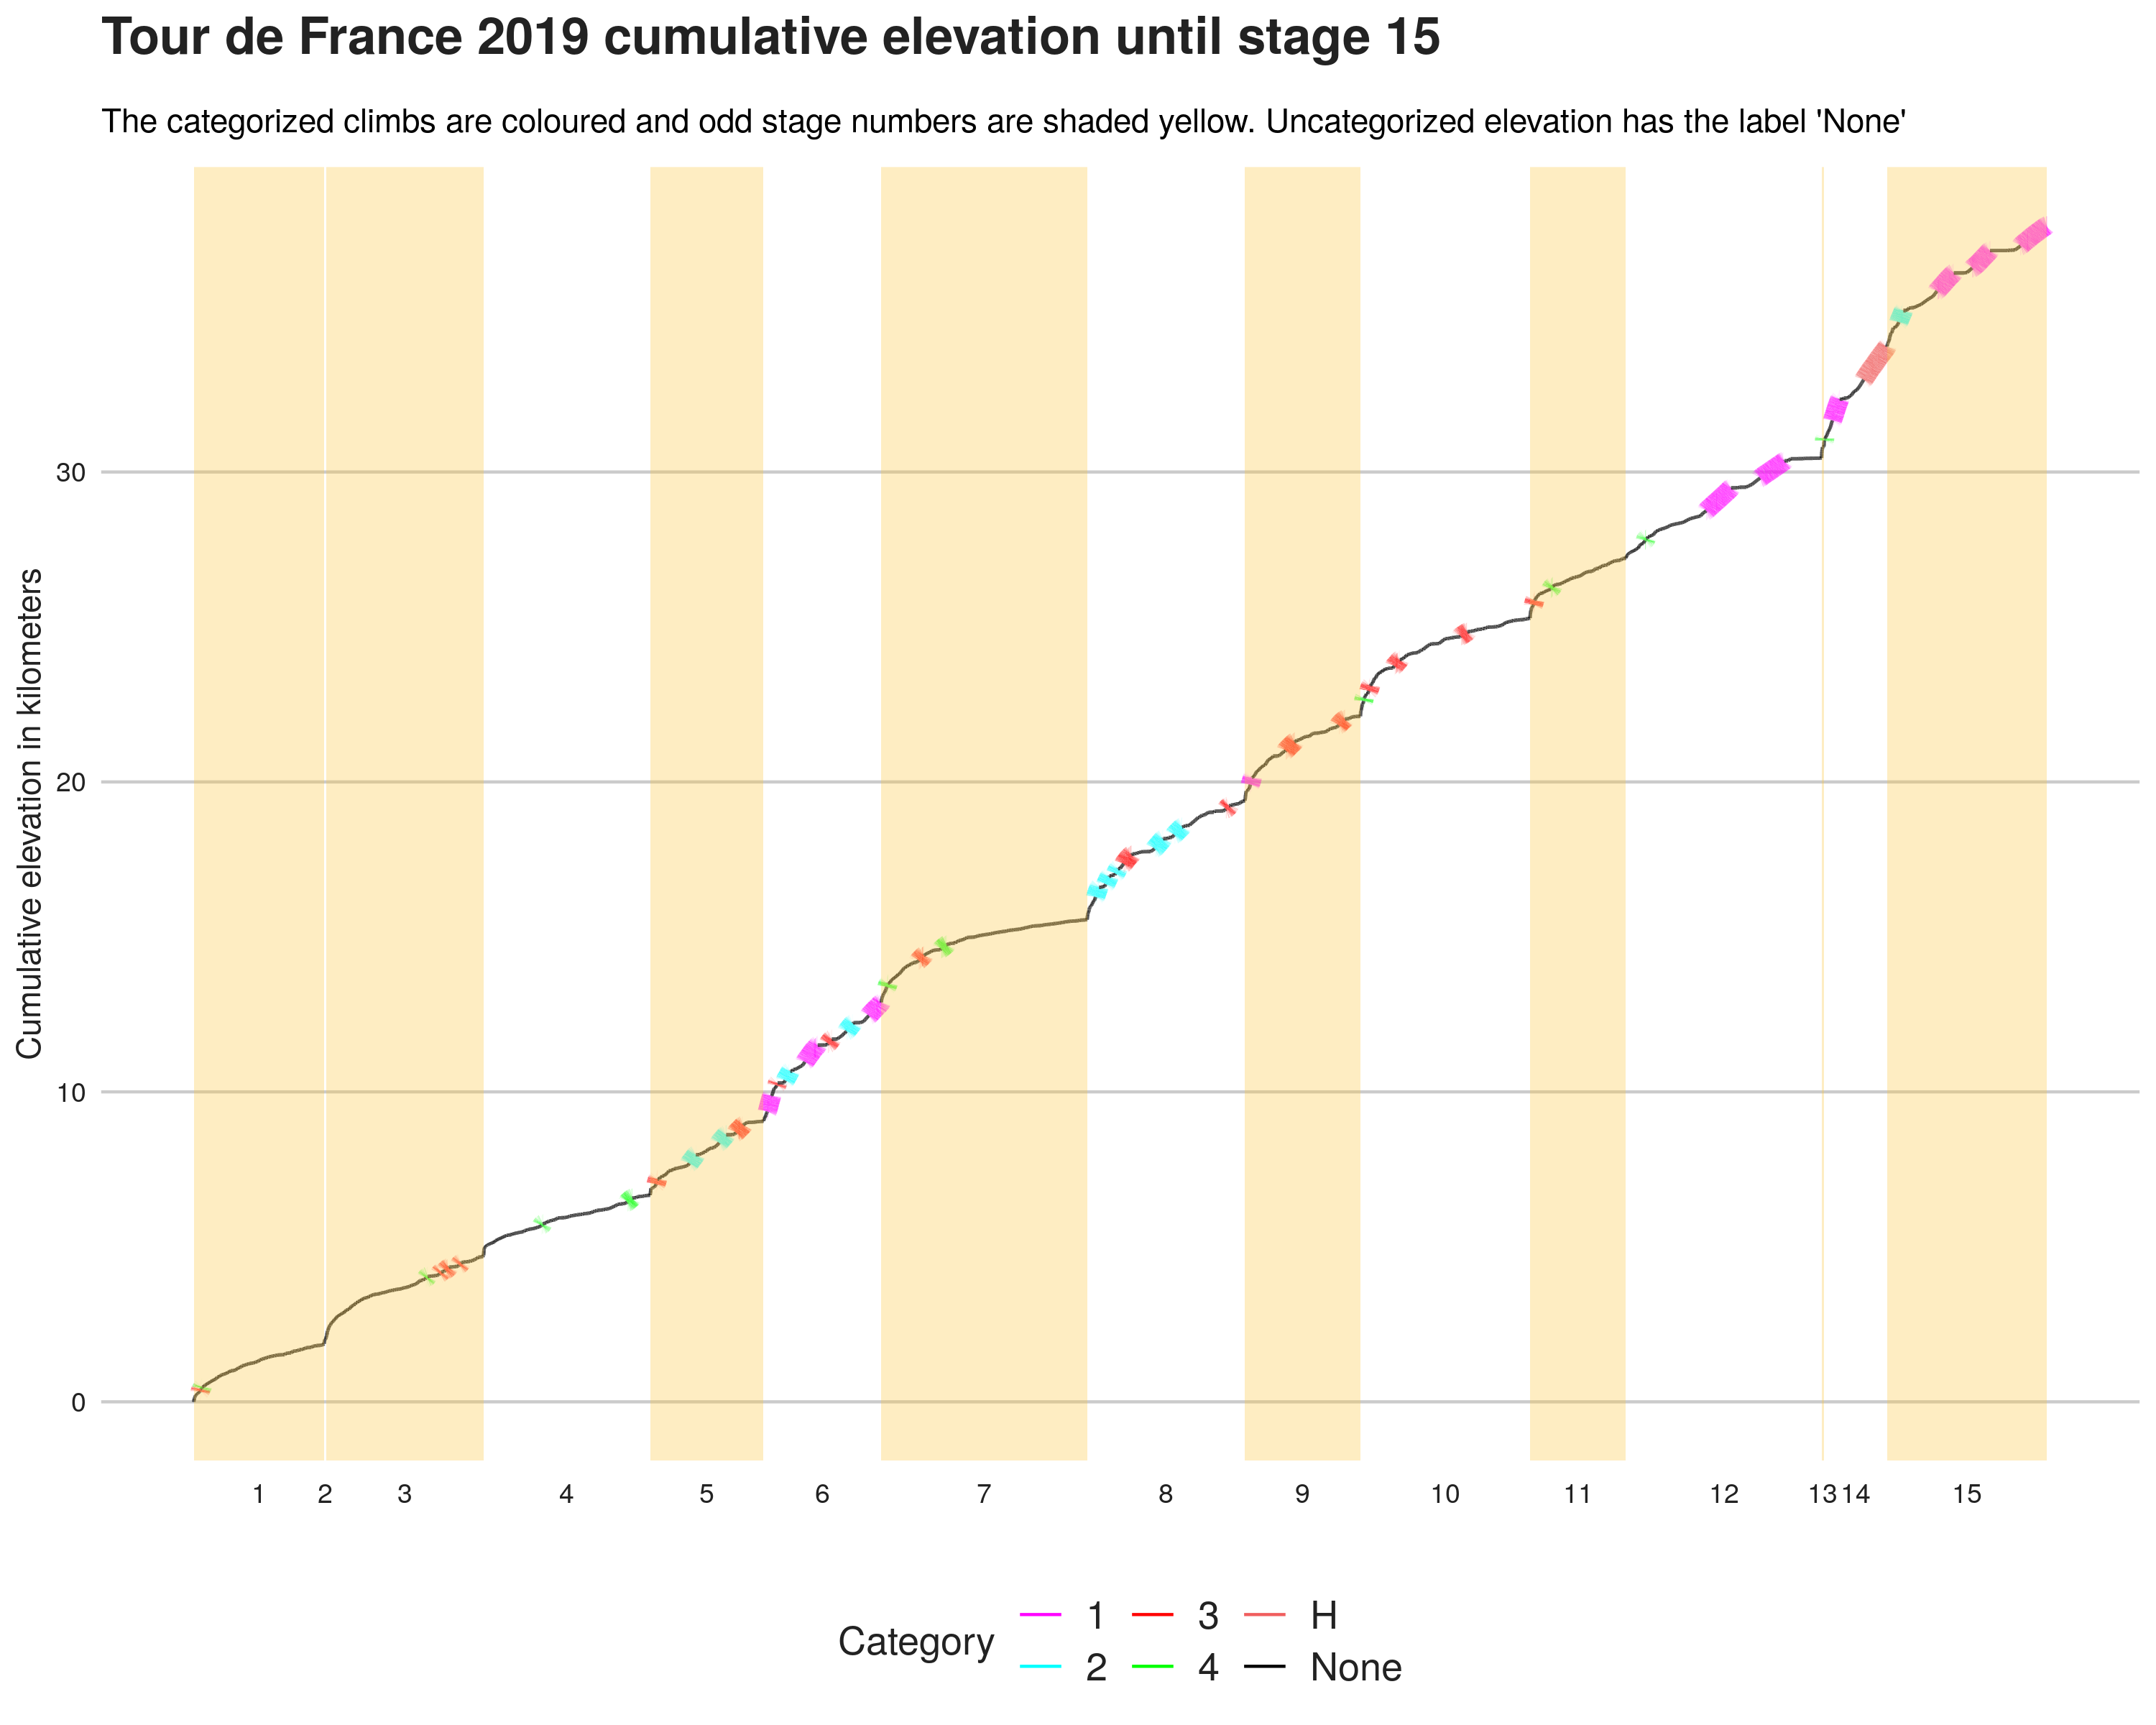
The last thing we will take a look at is the total cumulative elevation over the Tour de France until now. This is shown in Figure 4. In this figure you can see the total Tour de France distance covered on the horizontal axis and the cumulative total elevation on the vertical axis. The odd stage numbers are shaded yellow to increase the readability of the figure. So far the Tour de France had about 40 kilometers of climbing up to and including stage 15! You can also see that:
- Some stages start off with quite some elevation in the beginning, afterwards it flattens off. Take for example the flat stages 4, 7 and 10.
- Although stage 6 and 8 are packed with climbs and tough you see that in the Pyrenees (stages 12 up to 15) climb length increased and, consequently, climb categories got heavier.
- The slope of the line increased in the Pyrenees, this means more vertical meters per stage kilometer.
Stay tuned for the next post about the Tour de France mountains / polka dot classification.


