
Covid-19 and the Tour de France
Update 17-10-2020: Added a figure for the Giro (Sicily only) too.
This cycling season was disrupted abruptly by Covid-19 a.k.a. the coronavirus. The misery started February 27, 2020 when the UAE Tour was canceled after the fifth stage. Riders where quarantined in the desert, some longer than others. In the end the teams Cofidis, Groupama-FDJ and Gazprom-Rusvelo were able to leave the UAE on March 8. Fortunately, Ramon Sinkeldam and Arnaud Demare had a a Playstation that was smuggled into the hotel by Bas Tietema.
The following months were empty…… Given the whole pandemic (cancelled Olympics, Euro 2020, etc), I was delighted when the cycling started again. Actually a bit surprised as well, a huge event like the Tour poses quite a risk. The rider ‘bubble’ seemed quite nicely sealed and no rider was tested positive during the race. It took a while before I got used to the masked interviews but thats a small price to pay for daily entertainment. Although the Tour seemed without incidents for the riders, the past week(s) the news goes from bad to worse:
- Paris Roubaix cancelled.
- Amstel Goldrace cancelled.
- Confirmed Covid-19 cases (Simon Yates, Jan Bakelants, Kirsten Wild, Kruijswijk, Matthews)
Here we will ‘investigate’ the impact of the Tour de France on Covid-19 situation in France. The rider bubble during the Tour may have been sealed, but we have seen a lot of fans along the route screaming without masks at all. I guess they were shouting out some lockdown-frustration but in the end it may not have been be the wisest thing to do. We do this by looking at the Covid-19 data of the regional departments where the Tour de France stages started and finished.
Note that I put ‘investigate’ between quotation marks. This is by far not a full investigation, no statistical models are estimated, and I abstain from any claims regarding causality. My knowledge of the situations in all departments (for example about other events or possible delays in the publication of test results) and differences in Covid measures are simply too limited. Furthermore, we don’t know how many people from outside the region visited and in which regions they resided afterwards. However, as we will see below there are visual differences in how the Corona virus developed in the French departments before and after the Tour visited. Hopefully some lessons can be learned so that we can prevent more cancellations and enjoy a complete Vuelta up to November 8.
In the rest of this post I briefly explain how I collected the data and you will see some first results.
Data
For the analysis we need Covid-19 data, geographic data, and basic route info of the Tour. Let’s start with the French departments. I use the shapefiles found at data.gouv.fr and read and read them into R (that went fast thanks to VictorP). Next we need Covid-19 data. Again, we resort to data.gouv.fr. This dataset provides:
- the number of people tested and the number of people declared positive by age group (daily and weekly);
- the number of positive people over 7 rolling days.
The original file features the header dep, jour, P, T and cl_age90. These stand for the department, date, the number of positive tests, the number of performed tests and the age group, respectively. The Covid-19 data is on daily basis, however there is quite some weekly seasonality. For this reason we calculate the average percentage of positive tests using a rolling window of a week. This means that at every point in time we look back 7 days, calculate the total number of tests and positive results, and subsequently the average percentage of positive tests.
Finally, to determine when and where the tour was we need basic stage info such as displayed in Table 1. In order to quickly match the start and finish of each stage with the correct department I made an interactive map, also shown below. In Table 2 you can see for each departement the first and last time it hosted the start of finish of the Tour (columns 2 and 3). In column 4 you see the stages that the department hosted, including the type of stage (FLA=flat, HIL=hilly, MNT=mountain). We include this information because of the large number of spectators we have seen on some mountain slopes.
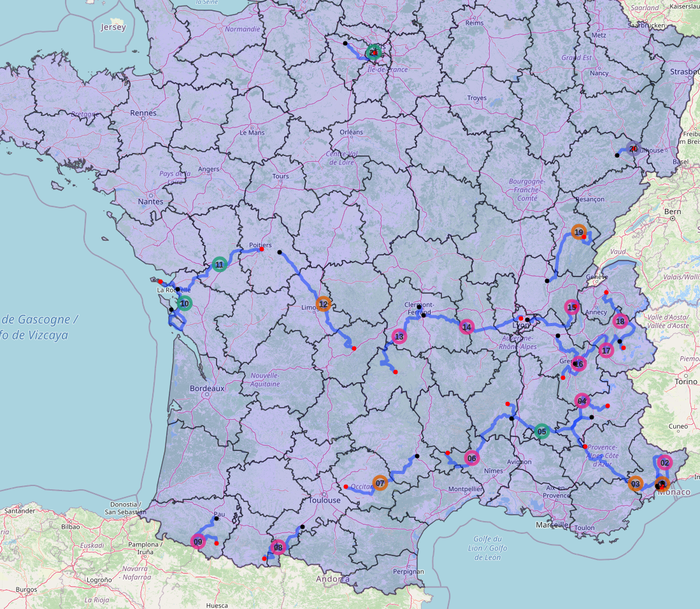
Figure 1: Map of the Tour de France route including the departements (this version is not interactive).
| Stage | Date | Start | Finish |
|---|---|---|---|
| 1 | 2020-08-29 | Nice Moyen Pays | Nice |
| 2 | 2020-08-30 | Nice Haut Pays | Nice |
| 3 | 2020-08-31 | Nice | Sisteron |
| 4 | 2020-09-01 | Sisteron | Orcières-Merlette |
| 5 | 2020-09-02 | Gap | Privas |
| 6 | 2020-09-03 | Le Teil | Mont Aigoual |
| 7 | 2020-09-04 | Millau | Lavaur |
| 8 | 2020-09-05 | Cazères-sur-Garonne | Loudenvielle |
| 9 | 2020-09-06 | Pau | Laruns |
| 10 | 2020-09-08 | Île d’Oléron Le Château-d’Oléron | Île de Ré Saint-Martin-de-Ré |
| 11 | 2020-09-09 | Châtelaillon-Plage | Poitiers |
| 12 | 2020-09-10 | Chauvigny | Sarran Corrèze |
| 13 | 2020-09-11 | Châtel-Guyon | Puy Mary Cantal |
| 14 | 2020-09-12 | Clermont-Ferrand | Lyon |
| 15 | 2020-09-13 | Lyon | Grand Colombier |
| 16 | 2020-09-15 | La Tour-du-Pin | Villard-de-Lans |
| 17 | 2020-09-16 | Grenoble | Méribel Col de la Loze |
| 18 | 2020-09-17 | Méribel | La Roche-sur-Foron |
| 19 | 2020-09-18 | Bourg-en-Bresse | Champagnole |
| 20 | 2020-09-19 | Lure | La Planche des Belles Filles |
| 21 | 2020-09-20 | Mantes-la-Jolie | Paris Champs-Élysées |
Results
Below you find two figures. The figures contain subplots of each departement visited by the Tour de France. There are vertical black lines indicating the date the Tour de France started or finished in the departement. Then you see yellow shaded regions that start 3 days after the first start or finish in the department and end 8 days after the last start/finish. The regions should correspond to the period where the majority of people should start getting symptoms of the virus based on the incubation times.
Most departements served once or twice as start, finish, or both. The exception is departement 6 (Nice), that hosted the start and finish of stage 2 as well as the start of stage 3. Also, departement 1 is a bit of a weird case. It served as the Tour visited on really separate occasions. It hosted the finish of stage 15 on the 13th of September (Grand Colombier) and the start of stage 19 (Bourg-en-Bresse) on the 18th. Both visits are marked on the chart, and because of the large difference between the two dates, the yellow shaded region is larger.
Because the tour visited 24 different departements, all results are split over two figures. In the first figure (Figure 2), you can find the results of the first 12 departements covering stage 1 up to 12. In the figure each department has a subplot with in the title bar the departement number, followed by the stages it hosted. Behind each stage number is indicated what type of stage it was (FLA, HIL, MNT for flat, hilly and mountain stages, respectively).
On the horizontal axis of the figures you see the date, the vertical axis shows the average percentage of positive Covid-19 tests per day calculated over the past week. Of course there are other measures we could have looked at, like hospitalizations or deaths, but these occur even later in time (it takes a while for an infected person to end up in the hospital, and in the end die).
The main insights from Figure 2 are:
- At the beginning of October you see in most regions an increase in the percentage of positive tests, this corresponds to increases across many countries in Europe and should have nothing to do with the Tour.
- For most departments I would argue that there is, visually, not much happening in the infection rate when the tour visited. Some . This is definitely the case for e.g. region 4 and 7 where the infection rate stays quite constant. In departement 31 the percentage of positive tests was already increasing before the Tour, and this increase keeps going at the same rate.
- For departments 6 (the first 3 stages around Nice), departement 5 (stages 4/5) and departement 12 (stage 7) and finally departement 81 (stage 7) you can see somehow an increase of Covid-19 infections that occurs shortly after the Tour de France visited.
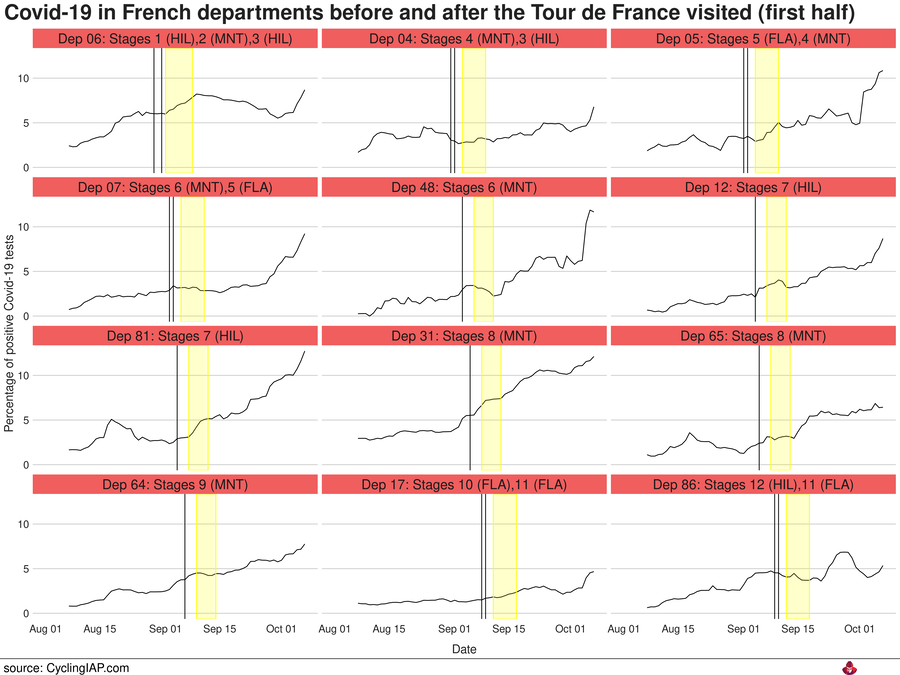
Figure 2: The percentage of positive Covid-19 tests per departement (daily averages over the past 7 days)that hosted the tour as start or finish location during the first half of the tour. The start or finish dates are marked with vertical black lines, the shaded yellow regions start 3 days after the first time the tour started/finished in the region up to the 8th day after they were in the region for the last time. In the header above each figure you see the departement number and the stage numbers it hosted as start / finish location.
The increases in departement 6 (first three stages around Nice) are pronounced, but perhaps no surprise given the long stay of the Tour. Once the Tour left Nice and the ‘incubation period’ (yellow region) is over, you can for example see a decrease in the percentage of positive tests again.
Next we move to the results of the rest of the departments that were involved in hosting stages 12 up to 21 (Figure 3).
- A large amount of departements (19, 69, 73, 74, 70, 78 and 75) already had an increasing percentage of positive Covid-19 tests before the tour arrived and it does not seem the spread accellerated afterwards.
- Departement 39 is a bit of an exception. The percentage of positive tests grows quickly after the Tour visited (although in absolute sense is still low).
- Departement 38 had already quite a steady increase in the percentage of positive tests. After the Tour this increase accelerated.
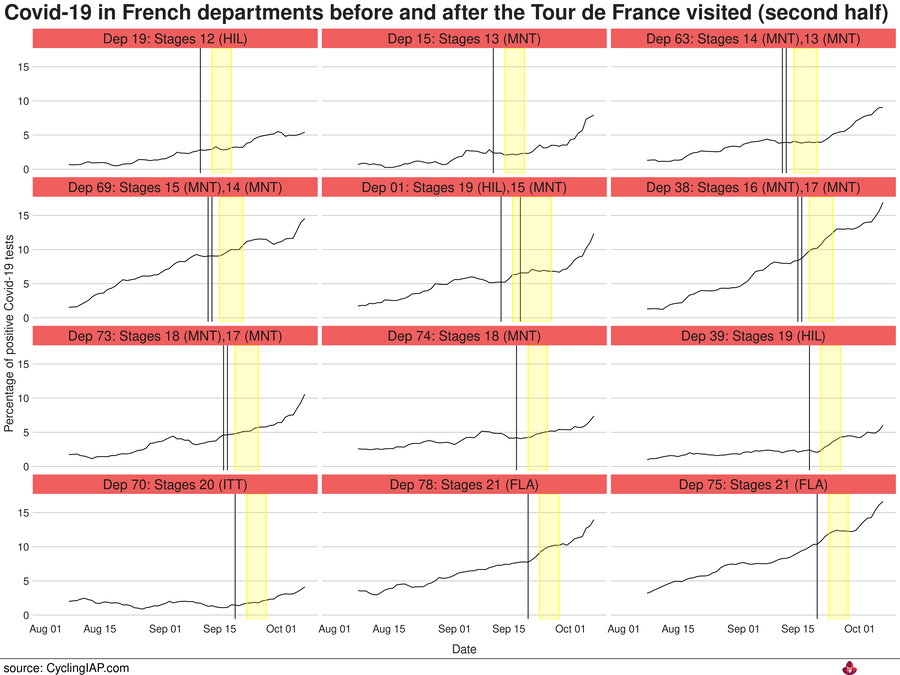
Figure 3: The percentage of positive Covid-19 tests per departement (daily averages over the past 7 days) that hosted the tour as start or finish location during the second half of the tour. The start or finish dates are marked with vertical black lines, the shaded yellow regions start 3 days after the first time the tour started/finished in the region up to the 8th day after they were in the region for the last time. In the header above each figure you see the departement number and the stage numbers it hosted as start / finish location.
Overall, I think the ASO managed to organize a huge event with minimal impact. No infected riders. At first that may seem suspicious given the number of positive tests in the Giro. However, first the timing is completely different, second, from what I read online there is really a difference in how secure the rider bubble is during the two races. The Tour de France visited in total 24 different regional departements. For 6 out of the 24 departements you can see an increase in the percentage of positive Covid-19 tests after the Tour left the departement (departements 6, 5, 12, 81, 39, 38). Again, this is no proof, I would say this can be the starting point of further investigation and perhaps the ASO can still learn a thing or two for the upcoming Vuelta.
The Giro
For Italy Covid data is available through a Github repo.
The data description can be found here.
From the downloaded regional data I used nuovi_attualmente_positivi, the total amount of new positive cases,
as well as the change in tamponi (the number of new tests performed). The rest
of the steps is identical as described for the Tour de France. Below you see
the results. Although the percentage of positive tests started to
increase already at the end of September, the Giro may have accelerated
the spread of the virus.
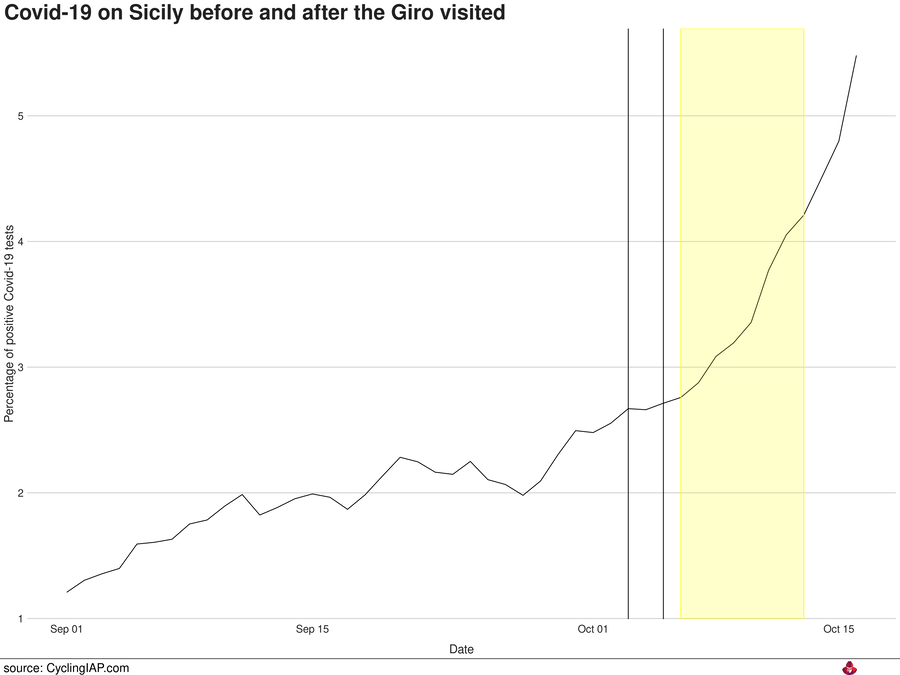
Figure 4: The percentage of positive Covid-19 tests on Sicily (daily averages over the past 7 days) before and after the Giro visited. The vertical lines indicate when the first (Oktober 3) and last (Oktober 5) Giro stages took place. The shaded yellow regions start 3 days after the first stage and lasts up to the 8th day after the last stage.